
A seismic profile gives us information about the sub-surface. However it is important to understand it is not a photograph or a cross-section but a seismic image, a picture of the earth seen through the ‘eyes’ of a seismic wave.
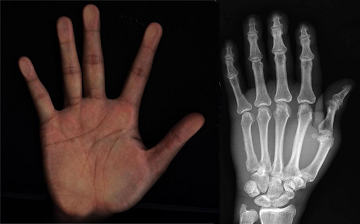 This is not such a strange idea, we are used to seeing x-ray images of our bones, such an image does not show skin, blood, veins or even cells, but they are still there in spite of the x-ray only imaging bones. Similarly seismic does not show everything, it only shows surfaces that reflect seismic waves.
Reflections and refractions
The seismic waves that make the image are those produced by our seismic source. These travel from the source down through the earth and are changed by the earth as they go. The speed at which the wave travels depends on the properties of the material it is travelling through. This speed is measured as the seismic velocity. Because each rock is different, its seismic velocity will be different, and it is where the velocity changes that a reflection or refraction will take place.
Seismic Velocity
Look at the table below to see how variable the velocity can be. There is a wide range of values as the rocks themselves are very variable. Things that affect the velocity at which the seismic wave can travel through a rock may be: degree of compaction, the presence of fluid, the type of fluid.
| Material | Typical seismic velocity (m/s) |
| Air | 330 |
| Water | 1400-1500 |
| Sandstone | 1400-4300 |
| Limestone | 5900-6100 |
| Clay | 1000-2500 |
The different parts of a seismic profile
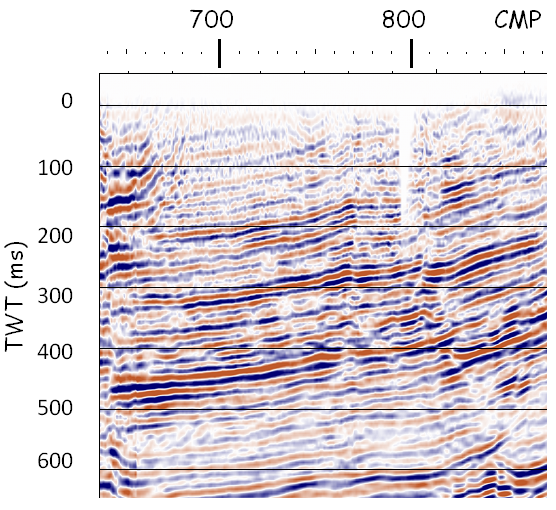
A seismic profile is made up of vertical CMP wiggle traces which are displayed in two way time. Read on to find out what this means.
Two way time (TWT)
Seismic profiles are displayed in two way time:
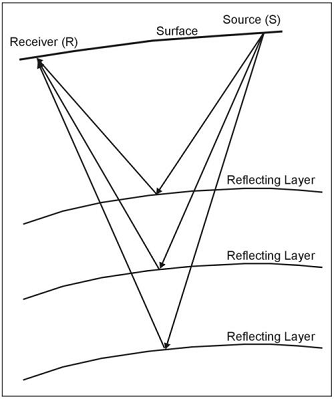
Two way time is the time taken for a surface-generated seismic wave to reach a subsurface rock layer and return to the surface. It is usually measured in milliseconds (1 second = 1,000 milliseconds).
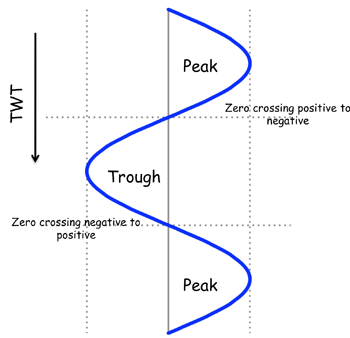
Peaks and Troughs
A seismic wave is often represented in diagrams as a straight line (as in the above figure). This shows it as a ray, and illustrates the path it follows. The wave itself though is a series of peaks and troughs, a wiggle trace.
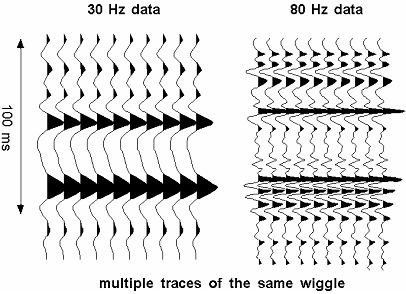
Looking closely at the wiggle trace shows it is composed of peaks and troughs with a zero crossing between the two. Seismic interpreters differentiate between a zero crossing from a peak to a trough (positive to negative) and from a trough to a peak (negative to positive).
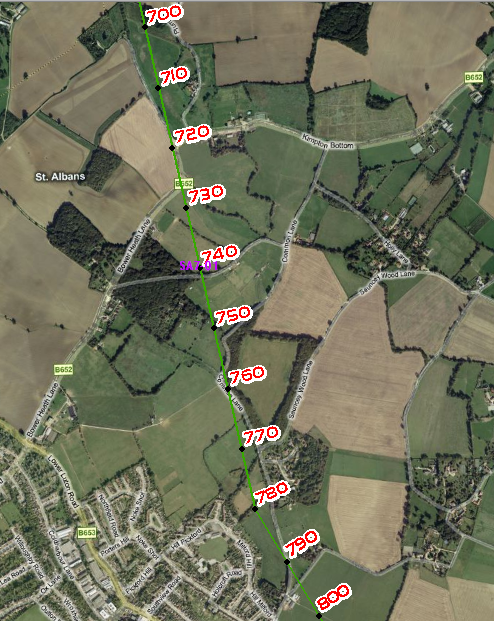
Common Midpoint (CMP)
The numbering system used across the top of a seismic profile is the CMP number. Each CMP is a vertical wiggle trace and has its own sequential number and x,y co-ordinate so that it can be located on an ordinance survey map. The distance between each CMP on a given seismic profile is the same, and a tradition has arisen in the seismic industry where 12.5m, 25m and 50m are the most common intervals. The zero crossings are important on the CMP wiggle trace, they represent the point of change, where the properties of one seismic layer are different to the next. The resulting change in velocity is seen on the seismic profile as a change of polarity (peak to trough, or trough to peak).
Depth
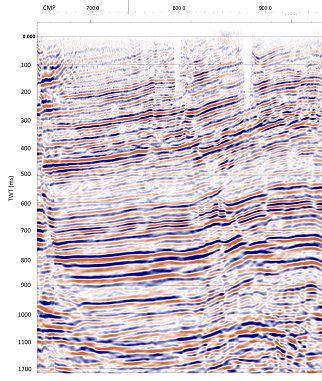
Converting TWT to depth is not a simple procedure, however it is possible to give a general idea of the depth a seismic profile can show by using an average velocity for all the rocks. In the profile shown here, we can allocate an average seismic velocity of 6000m/s for the data between 0 and 1200ms.
Calculate the depth at 1200ms.
- First convert the ms to sec so that the velocity and time match: 1000ms = 1 sec, therefore 1200ms =1.2 secs. However, as this is two way time we must make it one way time = 0.6 secs.
- Next use the equation: velocity = distance/time, it needs to be rearranged to give distance: Distance = velocity x time
- Now add in the values: Distance = 6000 x 0.6
- So at 1200ms on the seismic profile rocks imaged are at around 3600m or 3.6km below the surface.
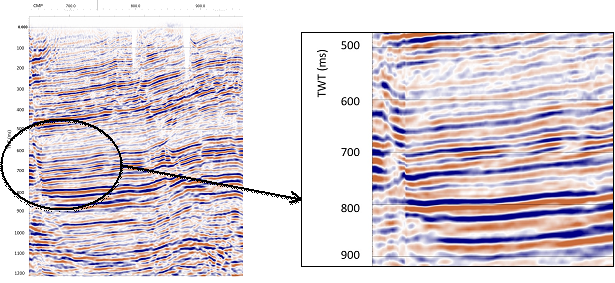
If we zoom up part of the seismic profile, we can see at about 800ms TWT a strong set of 3 seismic reflectors, blue-red-blue (peak-trough-peak). The TWT for this sequence (only the thickness of the blue-red-blue part) is 50ms, and the velocity is 6000m/s. Using the same equations as before, this gives a thickness of 150m to this set of reflectors.
Think about how much geological detail you would see in a 150m high sandstone cliff (how many individual beds for example). Hopefully you can now see the seismic is not the same as a cross section. The closest distance two features can be together and still be seen separately on seismic is about 10m, and this would only be possible near to the surface.

